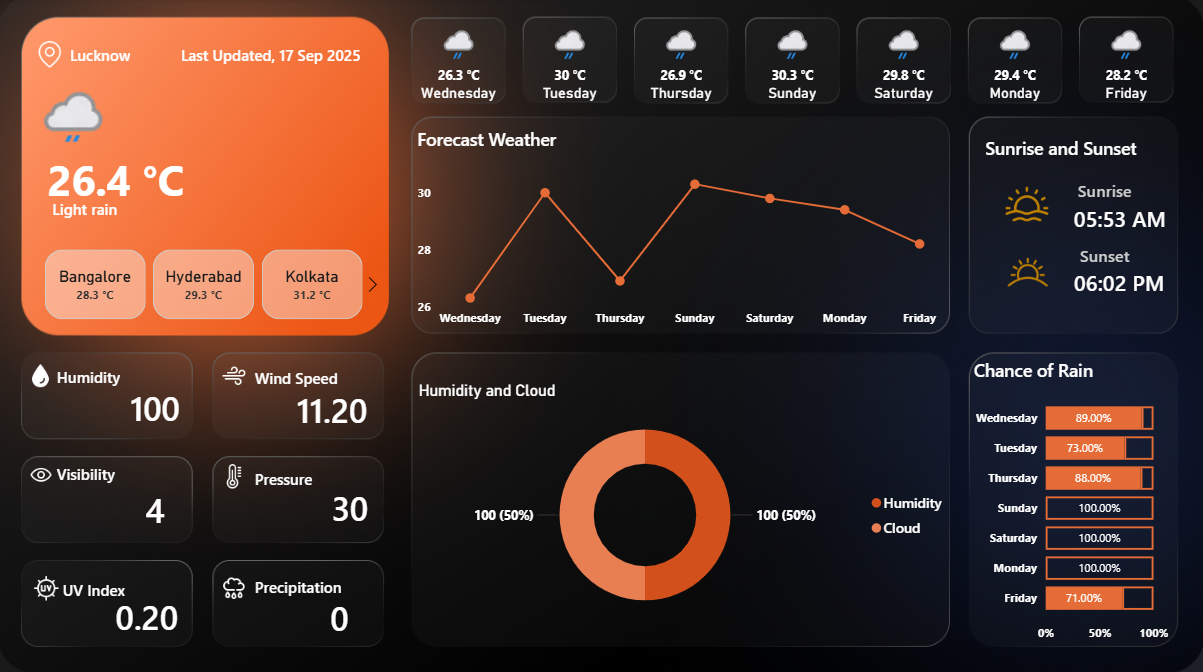
Weather Dashboard
A visually appealing weather analytics dashboard built using Power BI. It provides current weather conditions and forecast insights such as temperature trends, rain chances, air quality, humidity, and more.
Power BI • API

Empowering informed decision-making through data-driven insights, I specialize in extracting, transforming, and reporting complex data from diverse sources. With expertise in SQL, Python, Excel, and Power BI, I craft custom reports, charts, and interactive dashboards that distill data into actionable intelligence. Proficient in data manipulation and visualization, I uncover hidden patterns and trends, illuminating paths to business growth and optimization.
A visually appealing weather analytics dashboard built using Power BI. It provides current weather conditions and forecast insights such as temperature trends, rain chances, air quality, humidity, and more.
A real-world Data Analyst Portfolio Project based on an e-commerce inventory dataset from Zepto which demonstrates end-to-end SQL workflows,from raw data exploration to deriving business-focused insights.
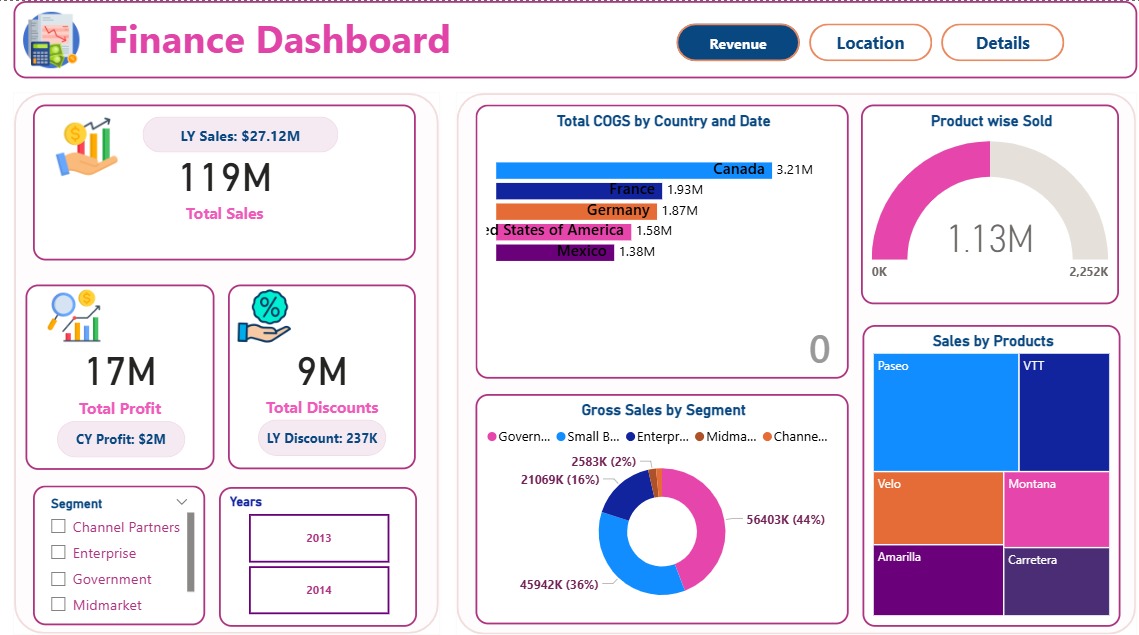
The dashboard has three headers: Revenue, Location, and Details. The Revenue page shows key financial charts, the Location page highlights geographical performance, and the Details page provides deeper analysis.
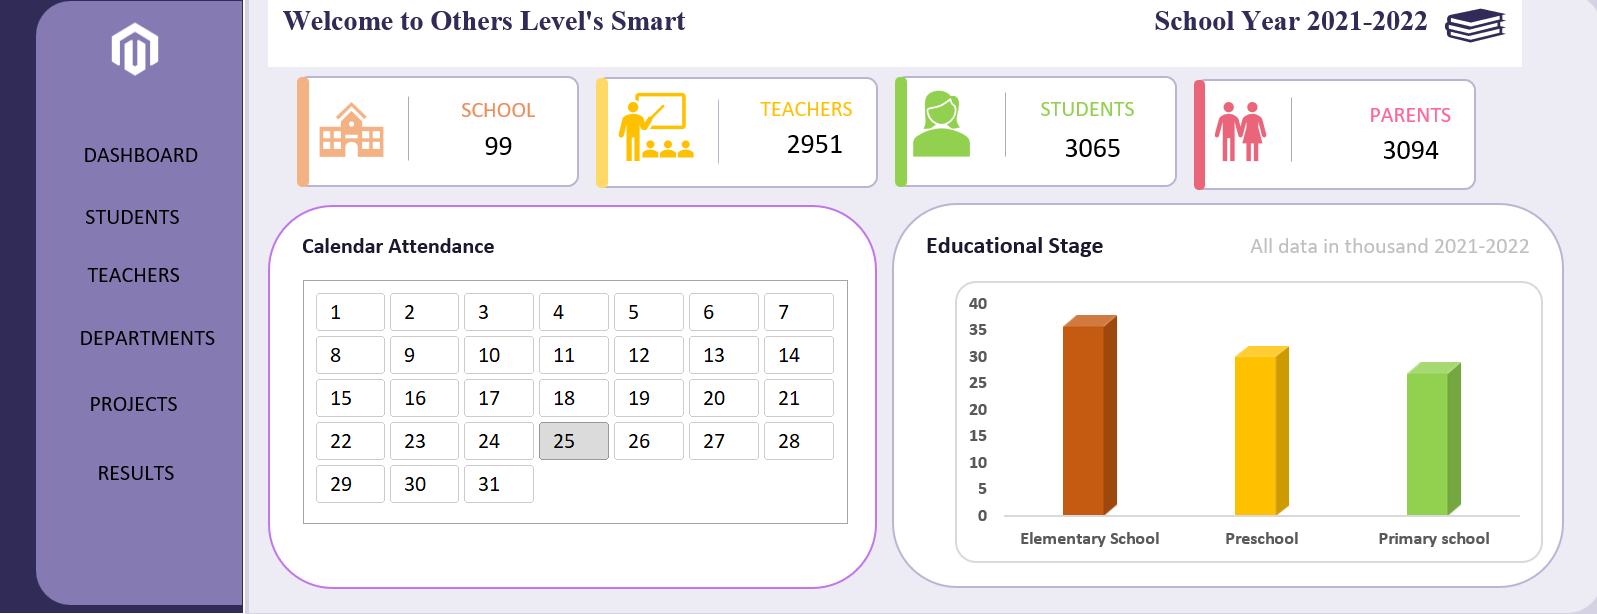
An interactive Dashboard built entirely in Microsoft Excel. This project visualizes school data for Students, Teachers, Departments, Projects, and Results in a professional, easy-to-navigate format with a sidebar menu.

This project explores a telecom company’s customer dataset using EDA to identify patterns in churn behavior, understand influencing factors, and recommend strategies to improve customer retention.
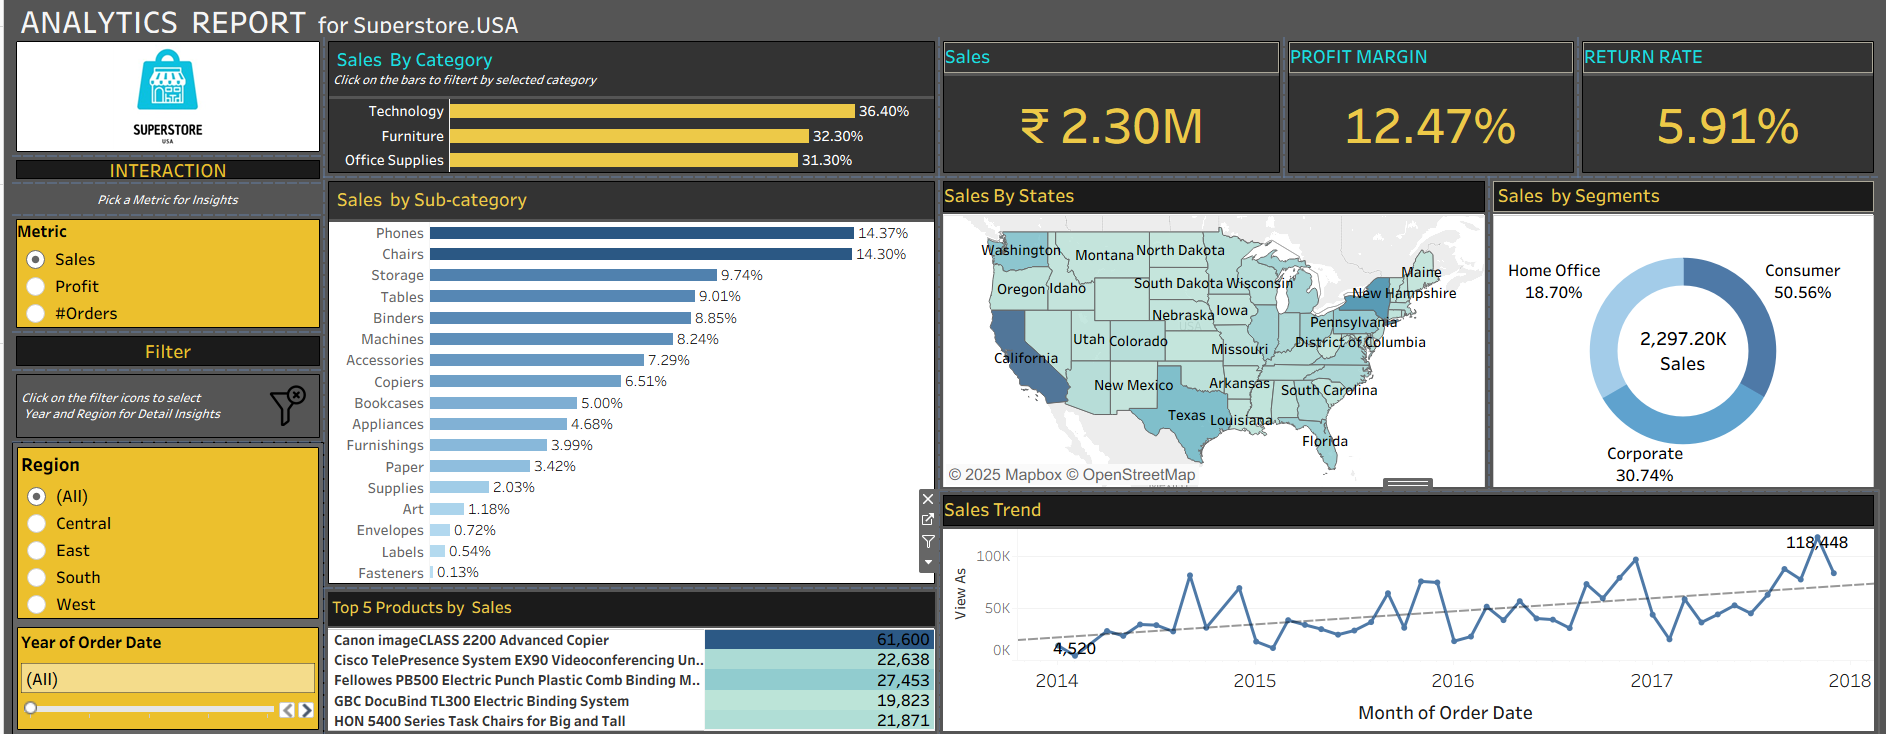
Tableau dashboard analyzing Sales, Profit & Orders for Superstore with dynamic KPIs, filters. It enables users to explore performance across categories, regions, and time using parameter-driven metrics.